Thing 3- Visual Learning
In this module I learned about graphic organizers, word clouds, QR codes, and info-graphics. These are all examples of ways to create visual learning experiences for my students and they can be used for classroom instruction, sharing information with communities and families, and also for furthering understanding of ideas. Visual learning is a teaching and learning style that uses pictures and visual aides to relay information in a way that is understandable and visually appealing and easy to read. I created several of my own visual aids that I can use in the future.

|
This is an example of a word cloud, which is a visual representation of words that can be used in a classroom for vocabulary practice, analyzing sets of words, introducing new topics, and so forth. I made this using Tagxedo.com. You choose the words you want to use, the shape of your word cloud, as well as the color theme. I made this word cloud for a social studies lesson about the Revolutionary War.
|
|
Graphic organizers are another great visual learning and teaching tool that I plan to use in my classroom. They are usually used for organizing thoughts and ideas, but can be used to introduce new topics as well as review old ideas combined with new ones. I created a graphic organizer that shows some of the basic ideas of the states of matter and properties of solids, liquids, and gases. This image is a screen shot of me making the organizer mid-process. The website I used for this was called Bubbl.us. This could be used when teaching about science as well as many other subjects and ideas.
|

|

|
I also created a Quick Response Code or QR Code. A QR Code can store a lot of information in one simple graphic image, and can be linked to a variety of things. Teachers can use them to provide information for their students, or provide links to websites, phone numbers, study guides, email addresses, or messages. The QR Code I created was made at http://qrstuff.com and it has my classroom website embedded in it (http://libbeyjones.weebly.com).
|
|
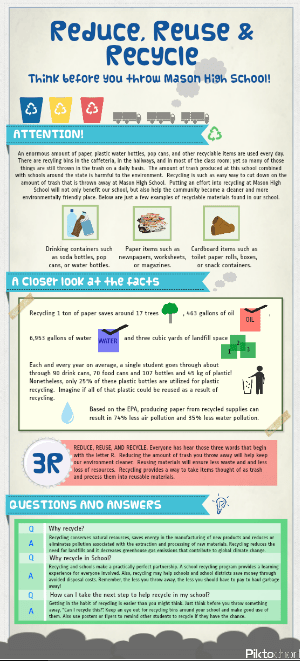
The last thing that I created was an infographic. These can be used in a variety of ways but are most often used to present data and/or images in a visually creative way. The infographic that I made at Piktochart.com is about recycling at the high school that I went to. It is a great tool to present information in a way that will catch the eyes of the target audience. I included pictures, stats, facts, and other pieces of information, all on one chart.
|
|
